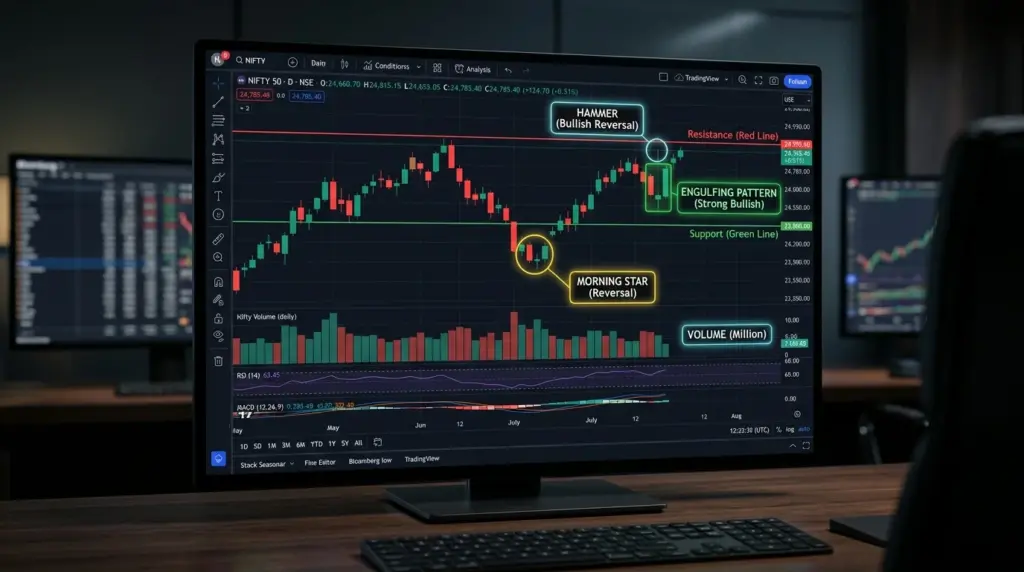
The 10 Most Powerful Candlestick Patterns in Indian Equities: Hammer, Doji, Engulfing & Stars
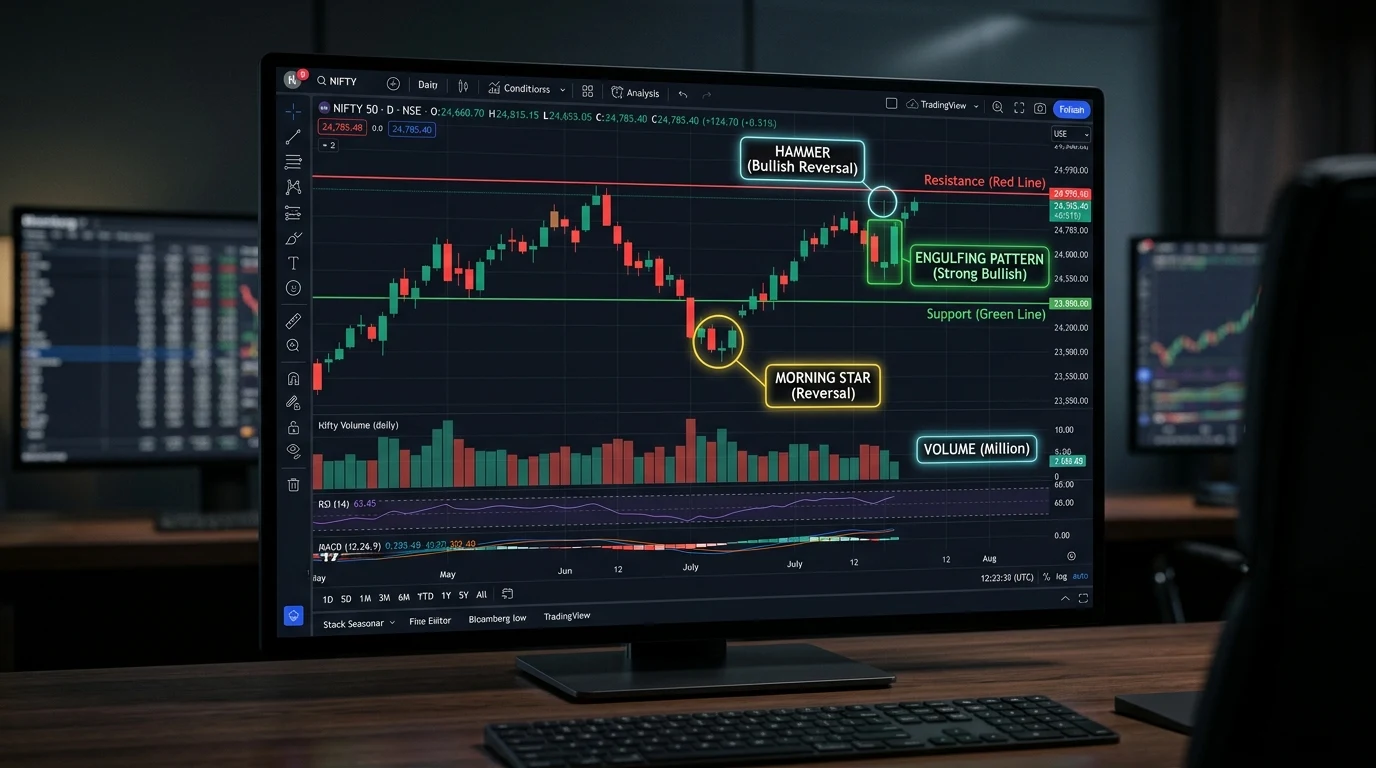
💡 Executive Summary: The Truth About Candlestick Patterns in Indian Markets
- Patterns Are Footprints, Not Holy Grails: A candlestick does not predict the future; it reveals the immediate psychological battle between institutional buyers (FIIs/DIIs) and retail participants at specific price levels.
- Location Dictates Probability: A Bullish Hammer formed in the middle of nowhere has a win rate under 35%. That exact same Hammer formed at a multi-week support zone, 20 EMA, and 0.618 Fibonacci level yields over 68% statistical expectancy.
- The Indian Market Nuance: With high retail participation in Nifty & Bank Nifty options, market makers actively engineer false candlestick breakdowns to harvest retail stop losses before launching genuine trend moves.
- Prasad Sogi's 4-Filter Mandate: Never risk real capital on a standalone candle. Every trade must satisfy Trend Context + Key Confluence Zone + Candlestick Trigger + Volume Follow-Through with a strict 1:2 minimum Risk-to-Reward ratio.
- Trading vs Investing Reality: While active technical traders use these patterns for intraday and swing setups, long-term wealth creators thrive by combining disciplined price action awareness with systematic wealth-building via stock market investing and systematic equity compounding.
1. Anatomy of a Candlestick: What Price Is Really Telling You
In 18th-century Japan, a legendary rice trader named Munehisa Homma realized that while supply and demand dictated the price of rice, markets were heavily driven by the emotions and psychology of buyers and sellers. To visualize this mass psychology, he developed what we now revere worldwide as Japanese Candlestick charting.
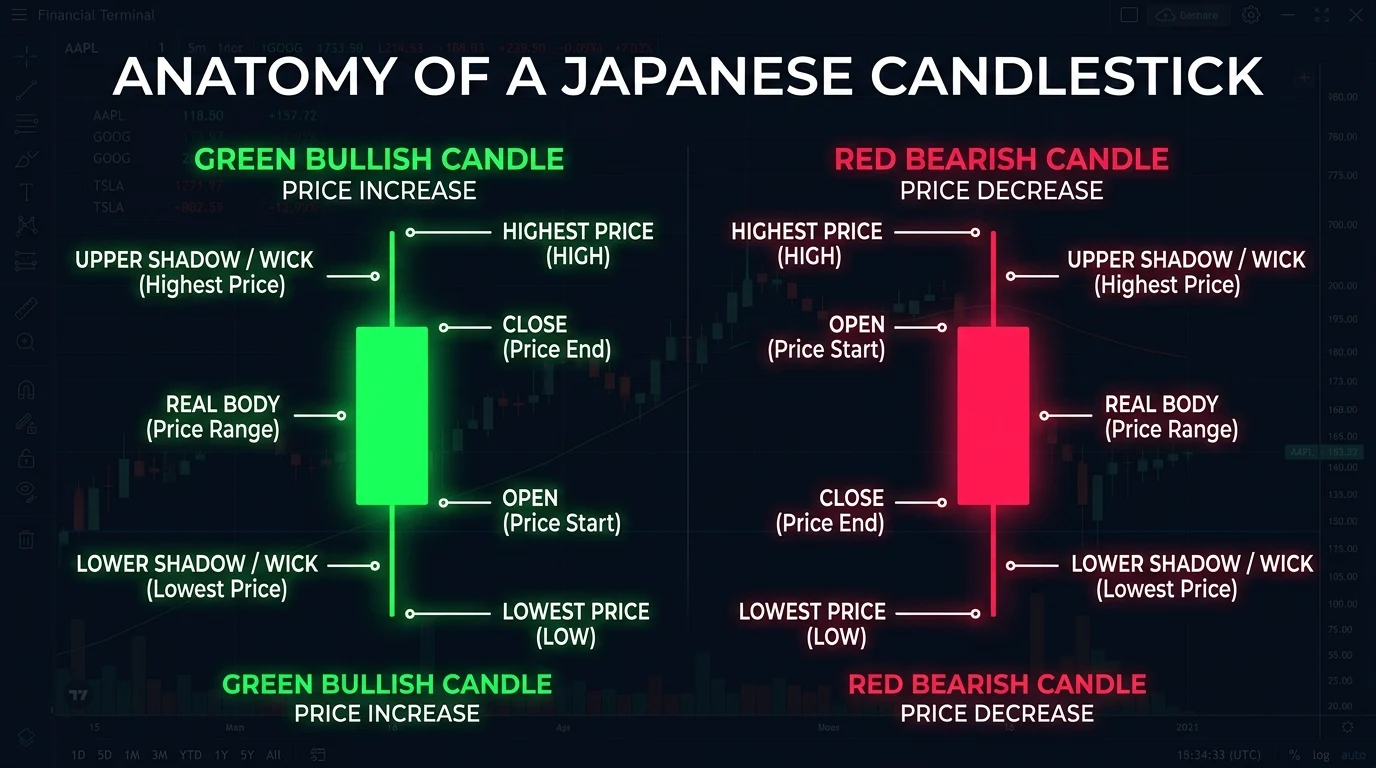
Unlike a primitive line chart that records only closing prices, a single Japanese candlestick records four distinct data points within any selected timeframe (whether a 5-minute intraday bar or a Weekly swing chart): Open, High, Low, and Close (OHLC).
Prasad Sogi's Chart Decryption Rule:
"Do not look at candles as green or red bricks on a screen. Every candle is an unedited battlefield report. The Real Body reveals who won the battle (Bulls or Bears), while the Wicks (Shadows) reveal where price was violently rejected. When you learn to listen to rejection wicks, you stop buying at the top and selling at the bottom."
To master the best candlestick patterns for trading, you must understand the three core anatomical components:
- The Real Body (Open to Close): Represents the net directional conviction over the time period. A wide green body demonstrates institutional dominance where buyers controlled the session from open to close. A wide red body reflects aggressive distribution and liquidation.
- The Upper Shadow / Wick: Illustrates the highest price reached during the period before sellers stepped in to drive prices lower. A long upper shadow reflects overhead supply and price exhaustion.
- The Lower Shadow / Wick: Demonstrates the lowest price reached before aggressive buyers entered to absorb supply and push prices higher. A long lower shadow reflects liquidity absorption and demand rejection.
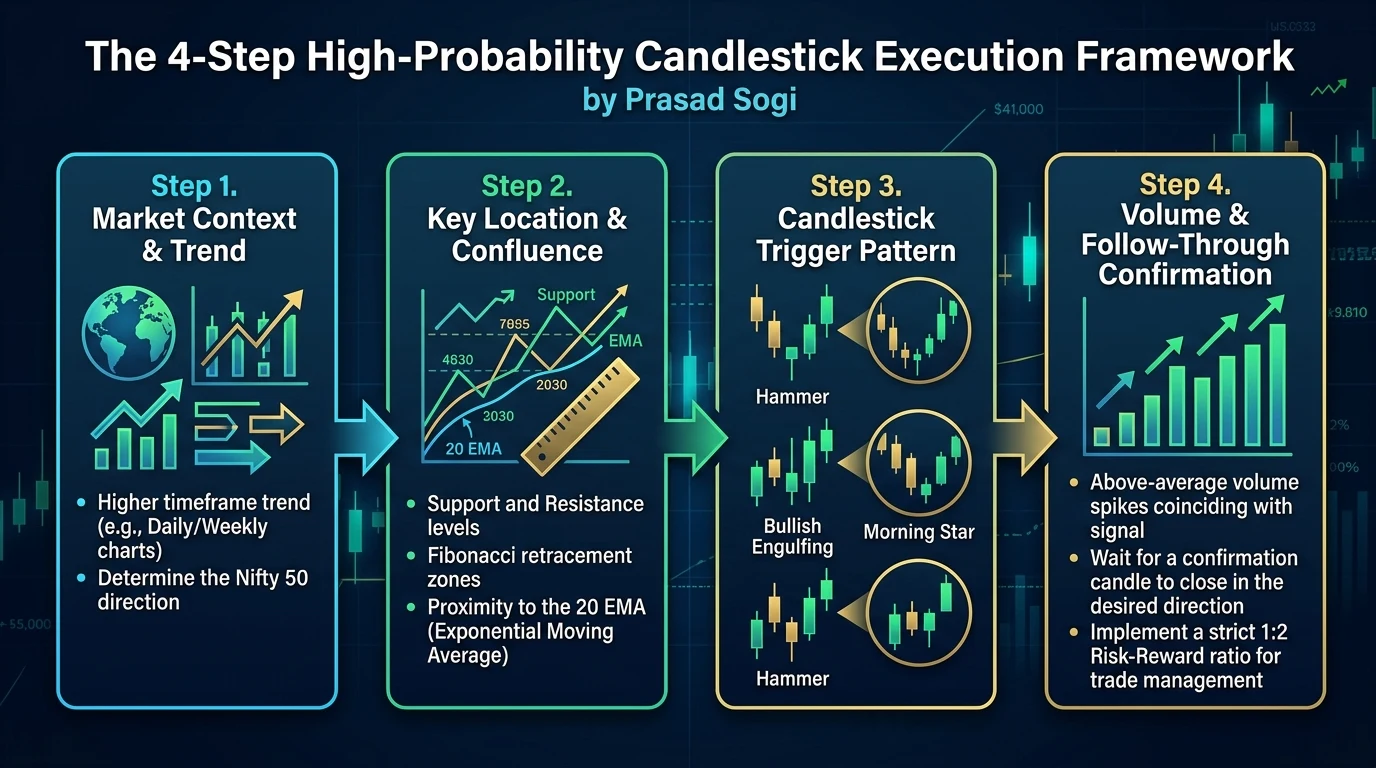
2. The 4-Step High-Probability Candlestick Execution Framework by Prasad Sogi
Why do so many traders buy a textbook "Bullish Hammer" on Nifty or Tata Motors, only to watch the stock immediately plunge through their stop loss?
Because they commit the cardinal sin of pattern isolation. In modern algorithmic Indian markets, where automated high-frequency trading (HFT) and institutional desks execute millions of orders, no single candlestick pattern works in isolation.
At InvestPlenty, we teach our students to filter every setup through our proprietary 4-Step High-Probability Execution Framework before placing a single order:
| Execution Step | Critical Filter Question | Professional Application on Indian Charts |
|---|---|---|
| Step 1: Market Context & Trend | What is the dominant higher timeframe direction? | Identify the Daily and 1-Hour trend on Nifty 50 and the target stock. Bullish reversal patterns carry 3x higher success rates when trading in the direction of the dominant weekly trend or following an extended, oversold pullback. |
| Step 2: Key Location & Confluence | Where is the pattern printing on the chart? | The pattern MUST touch an established institutional level: Prior Day High/Low (PDH/PDL), Key Support/Resistance, 20 EMA, or a 0.50–0.618 Fibonacci Golden Pocket. Ignore patterns forming in the middle of nowhere. |
| Step 3: Candlestick Trigger | Is the candlestick structurally pristine? | Verify the pattern geometry. A Hammer must have a lower wick at least twice the size of its real body with little to no upper shadow. Do not compromise on pattern quality. |
| Step 4: Volume & Follow-Through | Did institutions confirm the move with real capital? | Look for an above-average volume spike on the trigger candle. Wait for the very next candle to break and close beyond the trigger high (for long) or low (for short). Never pre-empt the close. |
Now, let us examine the 10 most powerful candlestick patterns engineered to extract consistent profits from Indian equities and index derivatives.
3. Pattern 1: The Bullish Hammer & Inverted Hammer
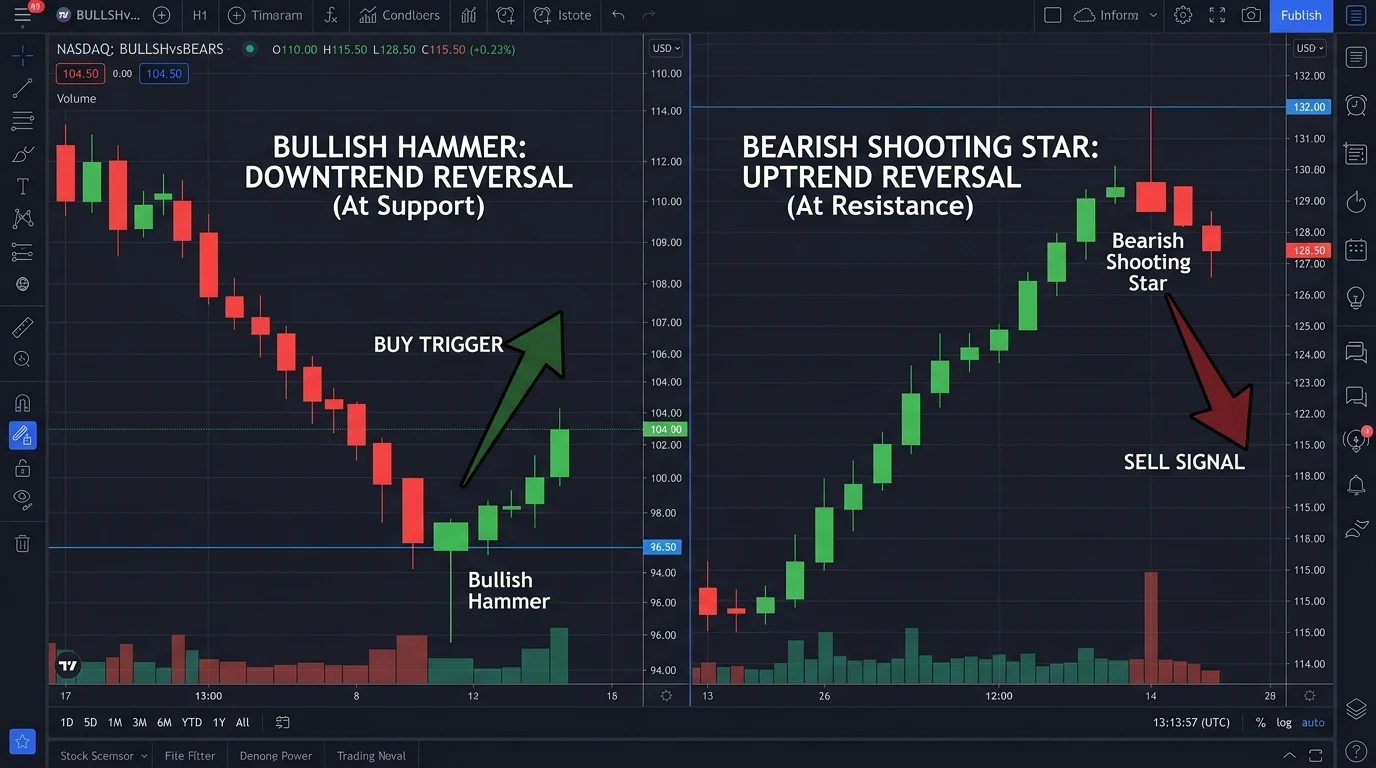
Structural Anatomy of the Hammer:
- Real Body: Compact, located at the upper end of the trading range. The candle can be green or red, though a green close indicates stronger buyer aggression.
- Lower Shadow: Long, slender tail measuring at least 2 to 3 times the height of the real body.
- Upper Shadow: Virtually non-existent (less than 10% of the body).
- Preceding Trend: Must appear after an established downward price move or a deep intraday correction.
Market Psychology in Indian Markets:
Imagine Nifty opening down 150 points due to negative Asian cues. In the first hour, panic-stricken retail traders dump long positions. Bears push prices down to a key support zone (e.g., 24,800). But at that precise level, Domestic Institutional Investors (DIIs) and smart money absorb every sell order, unleashing an aggressive buying spree that pushes the index all the way back up to close near its high of the day.
The resulting long lower shadow represents a massive liquidity sweep and rejection of lower prices. Bears are caught off-guard, and their covering bids will fuel the next leg up.
- Entry: Buy 1 tick above the high of the Hammer candle only after the confirmation candle closes.
- Stop Loss: Place strictly 2–5 points below the lowest tip of the Hammer's lower shadow.
- Target: Minimum 1:2 Risk-to-Reward ratio, aiming for the next structural resistance or 20 EMA.
4. Pattern 2: The Bearish Shooting Star (The Classic Topping Signal)
Structural Anatomy of the Shooting Star:
- Real Body: Small, positioned at the lower end of the candle's price range. A red close reflects superior bearish dominance.
- Upper Shadow: Very long, at least 2 to 3 times the height of the real body.
- Lower Shadow: Negligible or completely absent.
- Preceding Trend: Must appear after an extended upward rally or a retest of major overhead resistance.
The Indian Equity Trap (The 9:15 AM Opening Fakeout):
A classic trap on the National Stock Exchange (NSE): A high-beta stock like Reliance or Bank Nifty gaps up at 9:15 AM on euphoric news. Retail traders suffer intense FOMO (Fear Of Missing Out) and aggressively buy out-of-the-money Call options.
Institutions utilize this surge in retail liquidity to quietly offload enormous blocks of shares. By 10:30 AM, institutional selling overwhelms buyers, slamming the price back down to close near the session's open. The resulting Shooting Star leaves retail call buyers trapped holding rapidly decaying options.
- Entry: Sell / Short 1 tick below the low of the Shooting Star candle once confirmed by the subsequent candle.
- Stop Loss: 2–5 points above the highest wick of the Shooting Star.
- Target: Prior swing low or rising trendline support (aiming for at least 1:2 R:R).
5. Patterns 3 & 4: Bullish Engulfing vs Bearish Engulfing
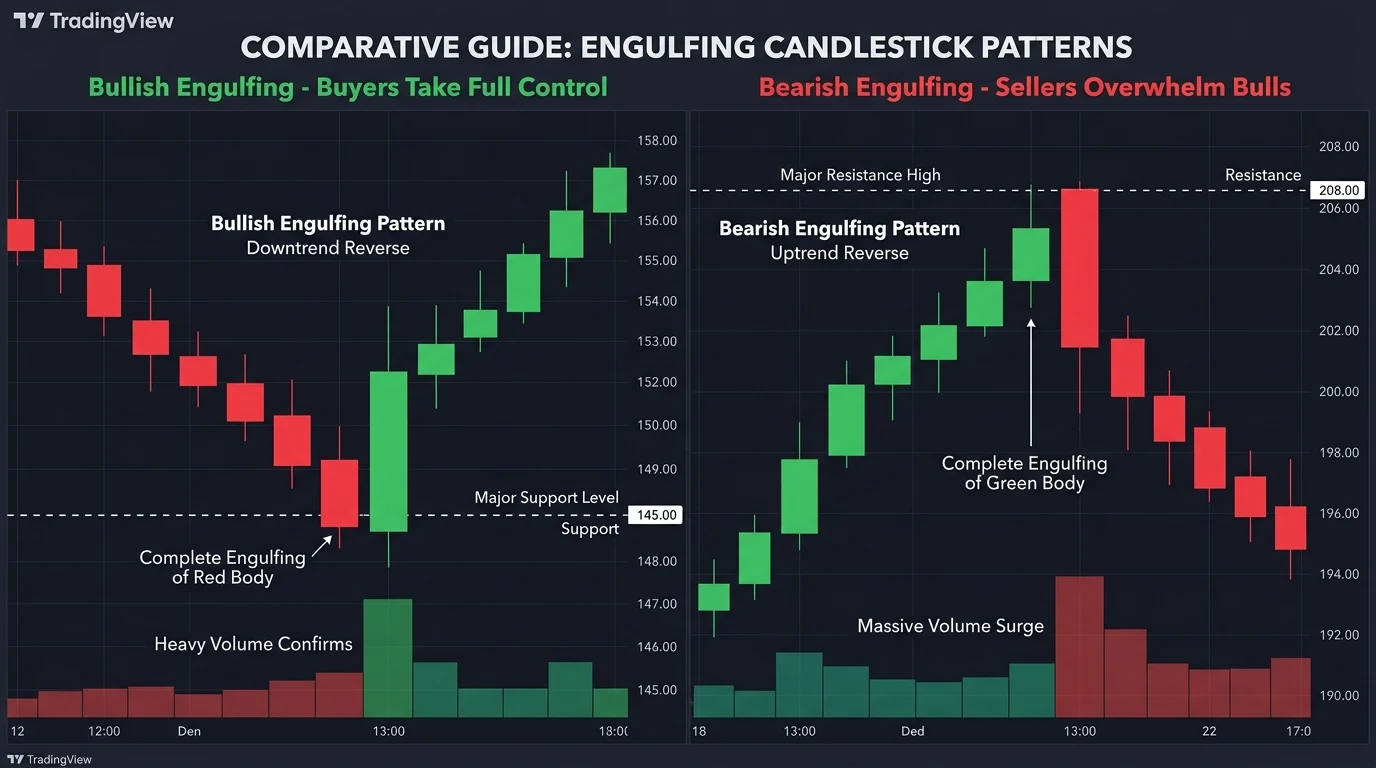
How Engulfing Patterns Shift Trend Dynamics:
An engulfing pattern is a powerful two-candle sequence that signals a 180-degree flip in market control. When it appears at an established support or resistance level with an accompanying surge in volume, it represents one of the most reliable chart patterns in technical analysis.
🟢 Bullish Engulfing
- Candle 1: Smaller red candle continuing the prevailing downtrend.
- Candle 2: Large green candle whose real body completely swallows/engulfs the entire real body of Candle 1.
- Psychology: Sellers attempted to push lower at the open, but massive institutional bids absorbed supply and drove prices higher with overwhelming momentum.
- Nifty Case Study: Frequent at key 50-day moving average pullbacks in bull markets.
🔴 Bearish Engulfing
- Candle 1: Smaller green candle continuing the uptrend.
- Candle 2: Wide red candle that opens higher but violently collapses, completely engulfing the prior green candle's body.
- Psychology: Buyers pushed price to a new high, but aggressive institutional profit booking and shorting wiped out days of accumulated gains in a single bar.
- Risk Warning: Often signals multi-week corrective phases in Indian mid-cap stocks.
6. Patterns 5 & 6: Morning Star & Evening Star (The 3-Candle Powerhouses)
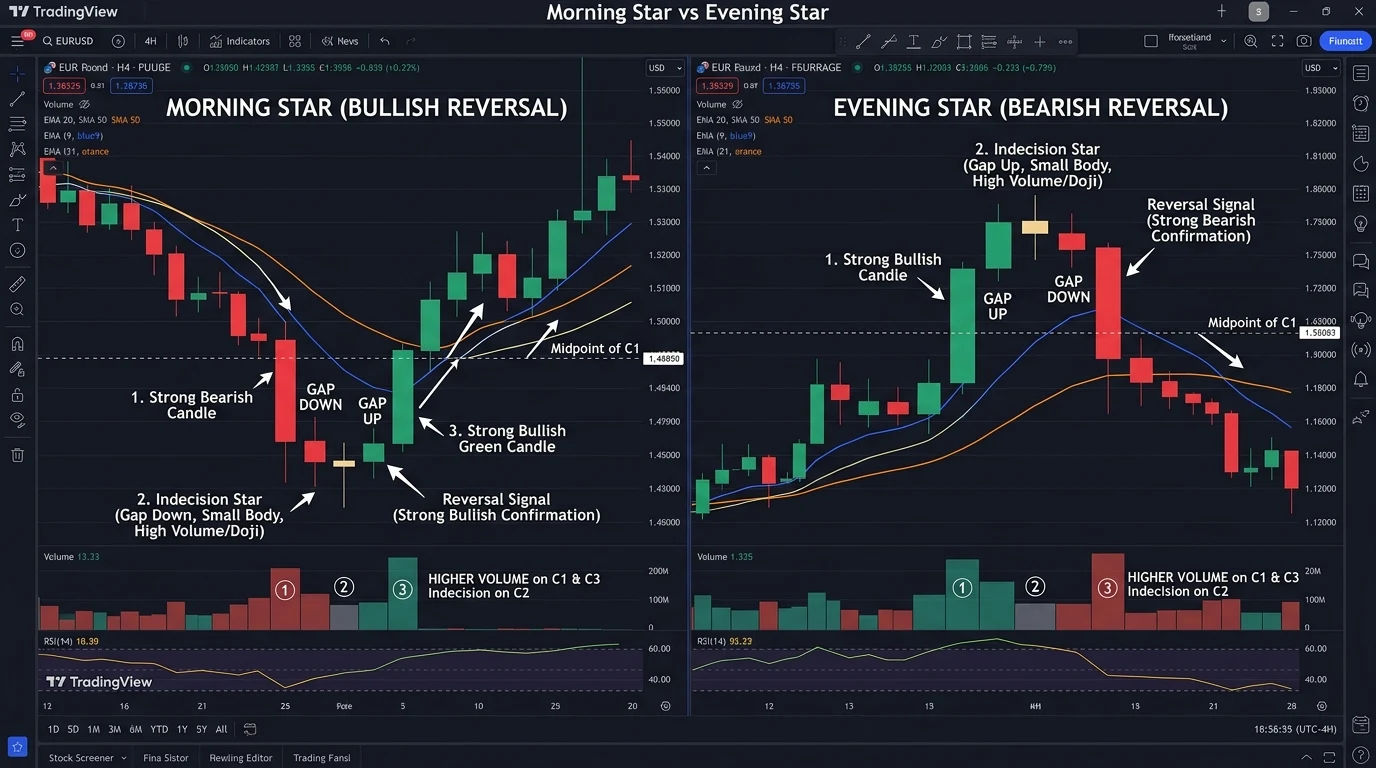
While single-candle patterns like the Hammer are fast, three-candle formations offer the greatest confirmation because they capture an entire three-phase emotional transition: Impulse → Indecision → Reversal Confirmation.
| Phase | Morning Star (Bullish Reversal) | Evening Star (Bearish Reversal) |
|---|---|---|
| Phase 1: Existing Momentum | Day 1: Long, decisive Red candle confirming the prevailing bear trend. Bearish confidence is at its peak. | Day 1: Long, decisive Green candle extending the bullish rally. Retail euphoria and greed dominate sentiment. |
| Phase 2: Momentum Stalling (The "Star") | Day 2: Small-bodied candle (or Doji) that gaps down. Price movement narrows dramatically, showing sellers are losing steam and supply is drying up. | Day 2: Small-bodied candle (or Doji) that gaps up into resistance. Price stalls, indicating buying power is completely exhausted. |
| Phase 3: The Reversal Blast | Day 3: Powerful Green candle that penetrates deep—at least 50% to 75% into the real body of Day 1. Volume surges noticeably. | Day 3: Violent Red candle plunging deep into the body of Day 1, closing below its midpoint with elevated selling volume. |
⚡ Pro Tip for Swing Traders in Indian Equities:
When an Evening Star forms on the Daily chart of Nifty 50 while the index is trading near its all-time high, smart options traders do NOT buy naked puts. Instead, they initiate defined-risk Bear Put Spreads or Bear Call Spreads. This protects capital against overnight gap-ups while capitalizing on the anticipated multi-session structural decline. To understand how India's top traders manage derivative risk, explore our deep dive on India's top young option traders.
7. Pattern 7: The Doji Family (Neutral, Long-Legged, Dragonfly & Gravestone)
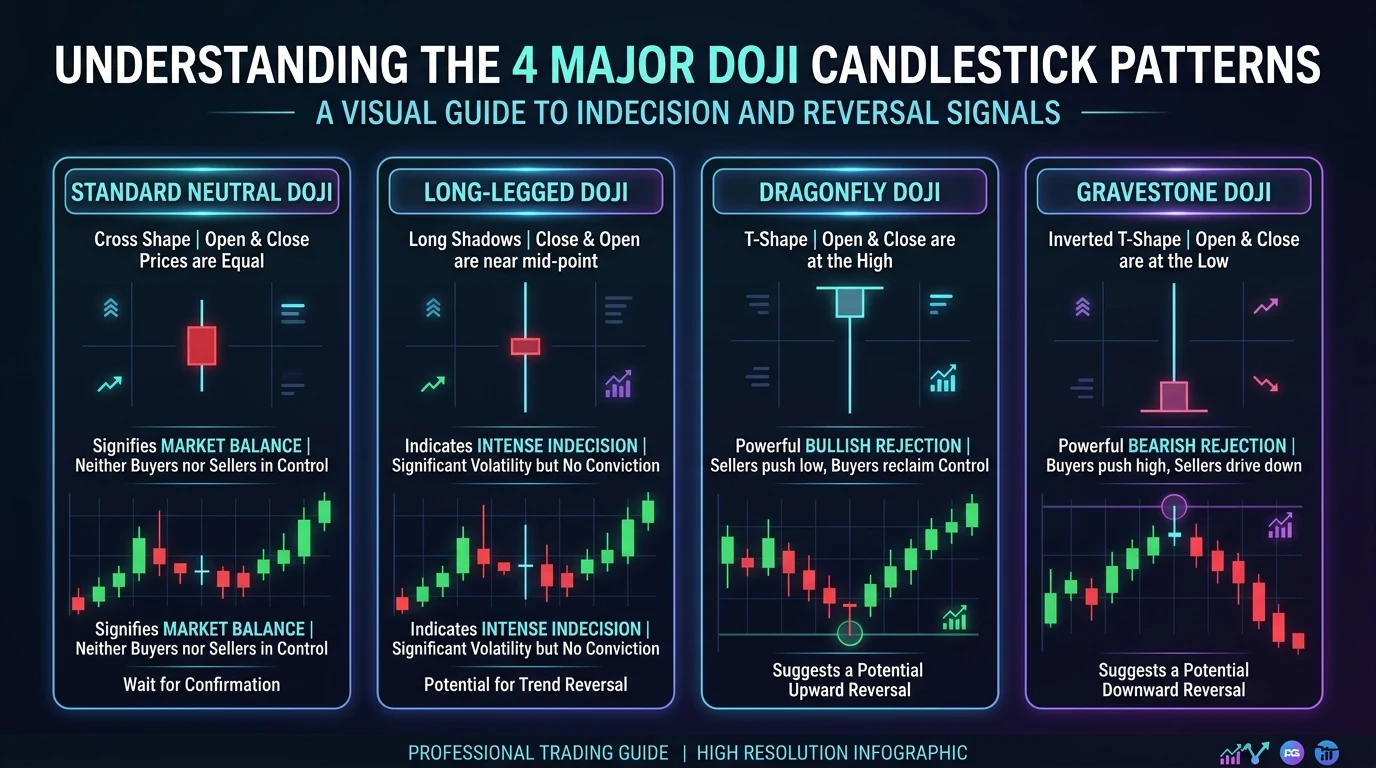
In Japanese, "Doji" translates to "same thing" or "clumsy mistake"—referring to the rare circumstance where the opening and closing prices are virtually identical.
A Doji tells you that despite immense price action during the session, neither the bulls nor the bears could gain a decisive advantage. Depending on where the shadows lie, Dojis fall into four distinct categories:
1. Standard Neutral Doji
A cross-like shape with equal upper and lower shadows. Reflects a total pause in trend momentum. A warning that a prevailing trend is losing steam.
2. Long-Legged Doji
Extreme upper and lower wicks showing severe volatility. Indicates aggressive institutional warfare where massive volume was transacted without net price displacement.
3. Dragonfly Doji (Bullish)
T-shaped pattern where Open, High, and Close are identical at the absolute peak of the session. The long lower shadow shows furious rejection of lower prices.
4. Gravestone Doji (Bearish)
Inverted T-shaped pattern where Open, Low, and Close are at the bottom of the session. The long upper shadow signals that a massive rally was totally crushed by sellers.
8. Pattern 8: Bullish & Bearish Marubozu (Pure Directional Conviction)
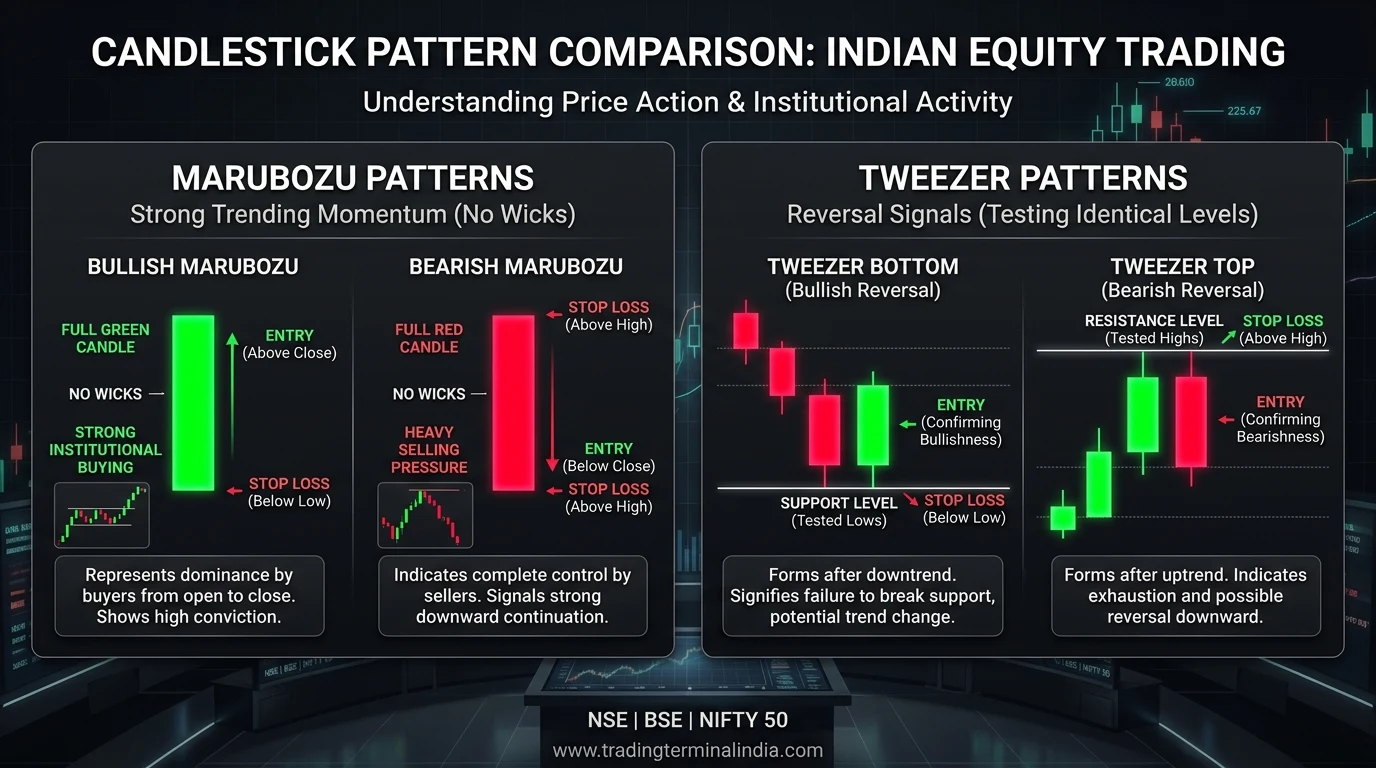
"Marubozu" in Japanese means "bald" or "shaven head"—a fitting description for a candlestick that possesses no shadows or wicks whatsoever.
- Bullish Marubozu: Open = Low and Close = High. From the opening bell at 9:15 AM to the closing bell at 3:30 PM, buyers were in total control. Every tick lower was bought instantly.
- Bearish Marubozu: Open = High and Close = Low. Sellers dominated the entire session without allowing buyers even a momentary bounce.
⚠️ The Retail Trap: Don't Chase an Extended Marubozu!
When amateur traders see a giant Bullish Marubozu candle on a 15-minute chart of Bank Nifty, they rush to buy market orders at the candle close. This is disastrous because your stop loss must sit below the candle open—creating an unacceptably wide risk. Professional traders wait for a shallow retracement to the 50% midpoint of the Marubozu body. If the 50% level holds as support, enter on the pullback with a tight, high-expectancy stop loss.
9. Patterns 9 & 10: Tweezer Tops/Bottoms & Piercing Line / Dark Cloud Cover
Pattern 9: Tweezer Tops & Tweezer Bottoms
Tweezer patterns are two-candle formations where two consecutive candles share the exact same high (Tweezer Top) or exact same low (Tweezer Bottom):
- Tweezer Bottom (Bullish): A red candle followed immediately by a green candle that dips to the exact same price low and rebounds. This proves that an institutional support floor exists at that specific rupee level.
- Tweezer Top (Bearish): A green candle followed by a red candle that tests the exact same high price and fails. Signals an immovable institutional selling wall.
Pattern 10: Piercing Line & Dark Cloud Cover
These two-candle setups exploit gap-open psychology at major market extremes:
- Piercing Line (Bullish): In a downtrend, Candle 1 is deeply red. Candle 2 gaps down at the open (triggering retail stop losses), but buyers storm in and drive price to close above the 50% midpoint of Candle 1's real body.
- Dark Cloud Cover (Bearish): In an uptrend, Candle 1 is strongly green. Candle 2 gaps up to new highs, but aggressively sells off to close below the 50% midpoint of Candle 1. The bulls' momentum is officially broken.
10. The 5 Fatal Mistakes 90% of Indian Retail Traders Make
According to SEBI's landmark study on retail trading performance, over 93% of retail traders lose substantial capital in Indian markets. When reviewing trading journals of retail participants, the same 5 fatal candlestick trading mistakes appear repeatedly:
| Fatal Retail Mistake | Why It Destroys Capital | Prasad Sogi's Professional Rule |
|---|---|---|
| 1. Trading Isolated Candles | Buying a Hammer in no-man's-land during a vicious intraday downtrend. | Location First: A pattern is only valid when touching a key daily level, 20 EMA, or Fibonacci retracement. |
| 2. Pre-empting the Candle Close | Entering a trade while the candle is still ticking, only to watch it collapse into a red bar in the final 30 seconds. | Strict Close Mandate: Never execute until the candle has officially closed and locked its OHLC print. |
| 3. Ignoring Volume Context | Believing an Engulfing pattern formed on anemic, below-average holiday volume. | Volume Validation: Genuine institutional accumulation requires volume at least 1.5x the 20-period moving average. |
| 4. Disastrous Risk-to-Reward | Risking 40 points on Nifty to make 15 points. One loss wipes out three consecutive wins. | Minimum 1:2 R:R: If your stop loss is 30 points, your profit target must be at least 60 points away. |
| 5. Overleveraging on 1-Min Noise | Trading candlestick patterns on the 1-minute chart where 80% of price action is random algorithmic noise. | Timeframe Discipline: Use 15-minute charts for intraday execution and Daily charts for swing trading. |
11. Master Price Action Live: Register for Prasad Sogi's Live Chart Breakdown Sessions
Reading about candlestick patterns in an article is simple; executing them in real-time when the market is fluctuating at 100 ticks per second requires hands-on experience, screen time, and expert mentorship.
Live Chart Breakdown & Price Action Masterclass with Prasad Sogi
Practical • Evidence-Based • Real-Time Nifty & Stock Chart ExecutionJoin Prasad Sogi, Founder of InvestPlenty and AMFI-registered market educator, for an immersive weekend interactive live chart breakdown. We will analyze live Nifty 50, Bank Nifty, and top equity setups, identify institutional supply/demand zones, and practice executing candlestick entries with zero guesswork:
- Live multi-timeframe top-down analysis on Nifty 50 & stocks
- Identifying genuine Hammer vs fake retail trap setups
- Interactive Q&A directly with Prasad Sogi
- Comprehensive price action, order flow & volume analysis
- Strict 1% risk management and daily position sizing models
- Lifetime community access and weekly live market reviews
12. Frequently Asked Questions (FAQ)

About Prasad Sogi
FOUNDER & LEAD STRATEGISTPrasad Sogi is the Founder of InvestPlenty, an AMFI-registered financial educator, and an active technical analyst based in Hubli, Karnataka. Prior to founding InvestPlenty, Prasad spent over 13 years working as a software engineer and enterprise technology specialist at global tech giants including IBM and Hewlett Packard (HP).
Actively navigating Indian stock and derivative markets since 2007, he combines mathematical rigor, algorithmic thinking, and strict risk-first discipline to mentor traders, conduct live chart masterclasses, and help Indian families build sustainable, stress-free wealth.