
Every single day in the Indian derivatives market, thousands of retail option buyers stare at Nifty and Bank Nifty charts waiting for a breakout. When a massive green candle violently pierces a multi-day resistance level, dopamine surges, buy orders flood the terminal, and breakout traders chase the momentum. Ten minutes later, the candle prints a monstrous upper wick, price violently collapses back inside the range, and their option premiums lose 40% of their value in minutes.
If this scenario sounds familiar, you are not suffering from bad luck. You are the victim of an engineered liquidity sweep. In institutional finance, this is known as a false breakout or a bull trap. Rather than falling victim to these vicious market maneuvers, elite algorithmic and proprietary desk traders employ a structured methodology: The Trap Trader Framework.
In this exhaustive masterclass, we will deconstruct the mechanics of institutional liquidity, explain why conventional textbook breakout patterns fail in modern index trading, and provide you with a battle-tested blueprint to spot, confirm, and trade false breakouts for asymmetric 1:3+ risk-to-reward opportunities. To complement this technical framework with broad portfolio longevity, review our core principles on proven frameworks for investing in the stock market.
1. The Liquidity Paradox: Why 80% of Textbook Breakouts Fail in Indian Indices
Conventional technical analysis textbooks teach a straightforward rule: "When price crosses resistance on high volume, buy the breakout; when price breaches support, short the breakdown." If retail trading were that simple, retail participants would not experience a 93% loss rate in Indian index derivatives, as revealed by SEBI’s landmark study.
To understand why breakouts fail, you must understand the Liquidity Paradox. High-frequency algorithms (HFTs), Foreign Institutional Investors (FIIs), and domestic institutional desks trade position sizes running into thousands of lots. When an institutional desk wishes to offload 50,000 lots of Nifty Call options or short Nifty futures, they cannot simply click the "Market Sell" button without triggering catastrophic slippage against themselves.
They require a vast pool of eager, passive buy orders to absorb their sell inventory. Where do millions of retail buy orders cluster? Right above the swing high or multi-day resistance level!
⚠️ The Brutal Reality of Breakout Traps:
The price does not break above resistance because buyers are strong. Smart money deliberately pumps the index by 15-25 points above resistance to trigger retail buy-stop orders and breakout FOMO. Once retail liquidity floods the market, institutions dump their massive sell positions directly into those retail buys, instantly reversing the index.
By learning to recognize this dynamic, you stop behaving as the liquidity provider for institutions. Instead, you wait patiently for the trap to spring, and you enter alongside smart money as retail traders are forced into liquidation. This discipline is precisely what distinguishes hobbyist traders from the strategies executed by top young option traders in India.
2. The 4-Phase Wyckoff Trap Anatomy
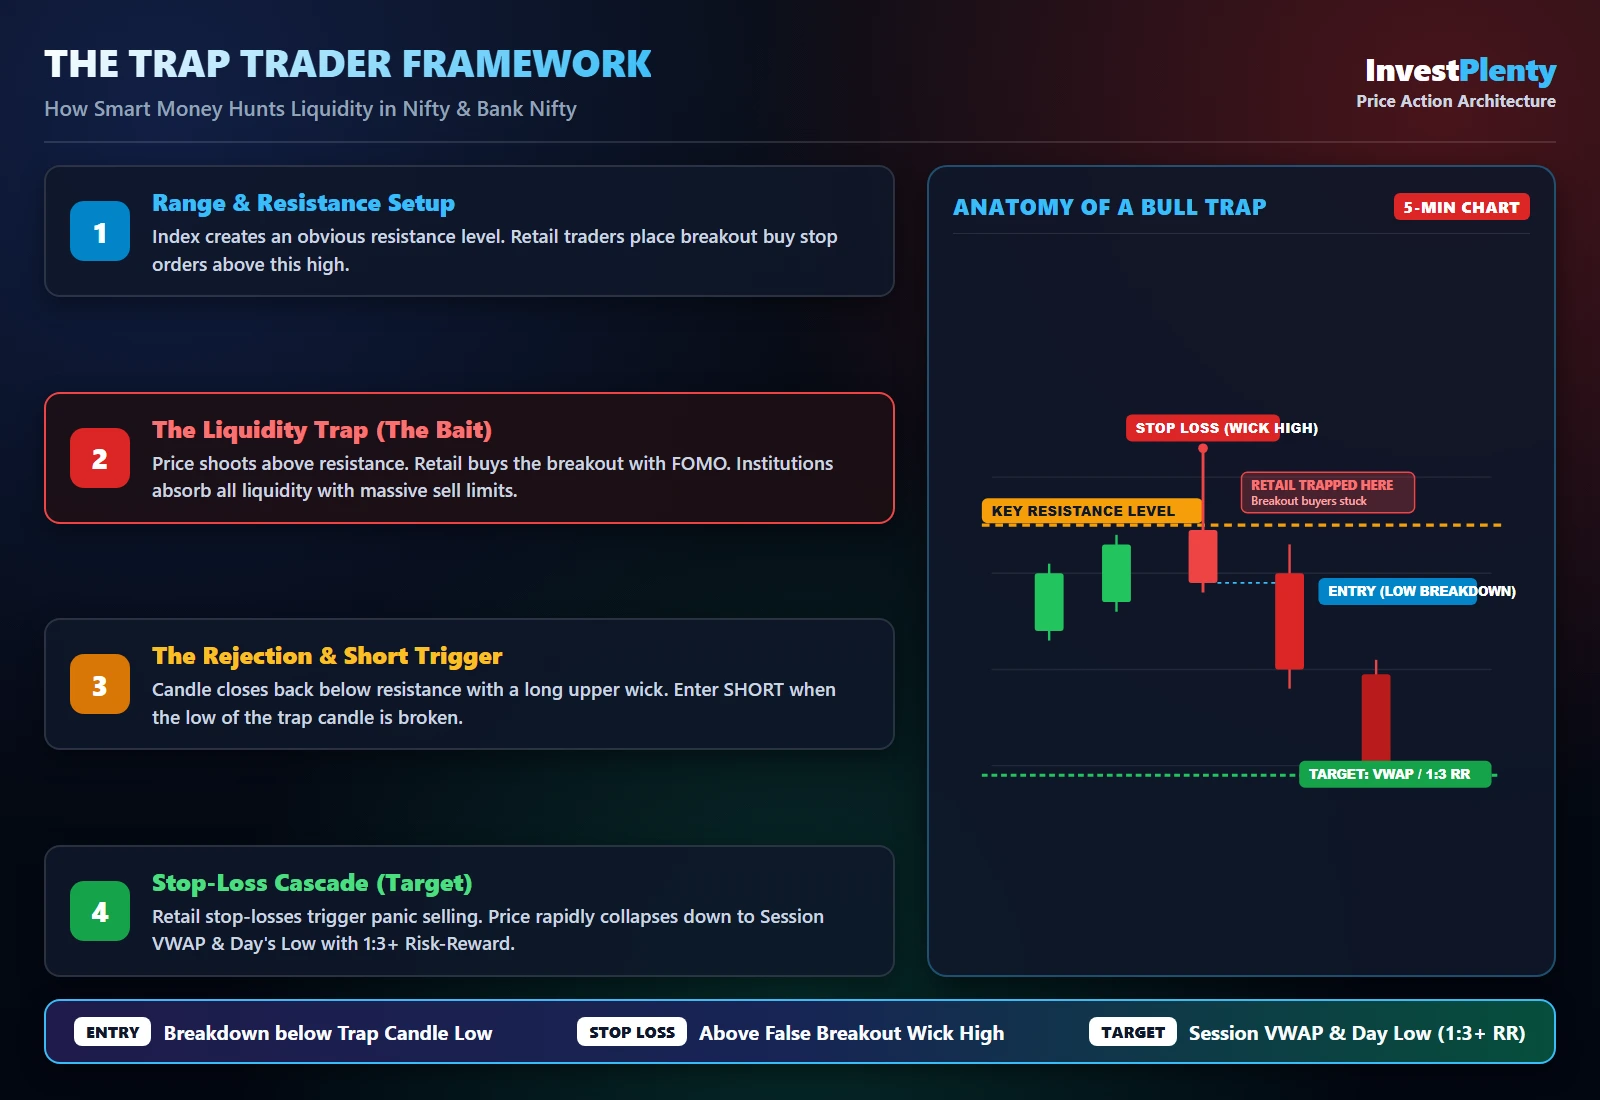
A false breakout is never random; it follows a predictable structural cycle first documented by legendary market technician Richard Wyckoff. In Nifty and Bank Nifty intraday 5-minute charts, this cycle unfolds in four distinct phases:
- Phase 1: Range & Liquidity Pool Formation (The Equal Highs): The index establishes a clean, visible horizontal ceiling (resistance). Retail traders mark this line on their charts. Stop-loss orders of existing short sellers and buy-stop orders of breakout traders accumulate just above this level.
- Phase 2: The Bait / Spring (The Liquidity Sweep): An explosive, fast-moving green candle penetrates the resistance line. News anchors on financial television announce a breakout. Retail option premiums spike, and retail momentum buyers jump into ATM/OTM calls.
- Phase 3: Institutional Absorption & OI Divergence: Behind the scenes, the Order Flow delta and Open Interest tell a contradictory story. While spot price makes a new high, Call Open Interest does not drop; instead, Call writers aggressively sell into the high. Institutional limit orders absorb the entire buying pressure.
- Phase 4: The Vicious Mean Reversion (The Stop-Loss Cascade): Price fails to sustain, prints a long upper shadow, and closes back inside the range. The moment price breaks below the low of that trap candle, retail breakout buyers panic and market-sell their positions, while aggressive short sellers pile in. This twin wave of selling sends the index plunging to the opposite side of the range.
3. Top 4 High-Probability False Breakout Setups in Nifty & Bank Nifty
Setup 1: The Previous Day High (PDH) / Low (PDL) Liquidity Sweep
The Previous Day High and Low are the two most watched benchmark levels on Indian trading desks. In over 60% of trading sessions, Nifty or Bank Nifty will open, trade toward the PDH, pierce it by 10 to 20 points, and reverse.
- The Setup: Morning price rallies to yesterday's high. A 5-minute candle breaches the PDH by 12 points, but the subsequent candle fails to create a higher high.
- The Trigger: Wait for a 5-minute candle to close below the PDH. Enter short (Buy ATM Put / Sell OTM Call) as soon as the low of the rejection candle is breached.
- Stop Loss: 5 points above the high of the sweep wick. In Nifty, this gives a phenomenal stop loss of just 15-18 points!
- Target: Daily VWAP and the Previous Day's Close (PDC).
Setup 2: The Failed Opening Range Breakout (ORB Trap: 9:15 to 9:45 AM)
Retail textbooks preach trading the 15-minute Opening Range Breakout (ORB). However, in modern algorithmic markets, the 9:15-9:30 AM range is dominated by retail retail orders and overnight stop-loss triggers.
When a strong 9:30 AM candle breaks the 15-minute high, watch the 9:40-9:50 AM window closely. If the market fails to sustain higher prices and slips back into the first 15-minute range, it signals that domestic institutions rejected the higher prices. Fading an ORB breakout often delivers a full sweep to the opposite side of the day's range.
Setup 3: The Trendline & Chart Pattern Trap
Retail option buyers love drawing ascending trendlines and symmetrical triangles. Market maker algorithms are programmed to identify these exact diagonal lines. A sharp wick down through a popular trendline trips retail Put buyers, only for price to instantly rebound and rocket in the original direction (a classic Bear Trap).
Setup 4: Round Strike Psychological Traps (The "00" Strike Sweep)
In Nifty (e.g., 25,000, 24,500) and Bank Nifty (e.g., 52,000, 51,500), round numbers attract colossal Open Interest (OI) from institutional option sellers. When spot price breaks above 25,000 by 15-20 points, retail buyers assume a massive short-covering rally is imminent. If option writers refuse to cover their 25,000 Calls, that breakout is an absolute death trap for Call buyers.
4. The Confluence Filter Suite: How to Confirm Traps in Real Time
A professional trap trader never guesses or enters blindly. Before executing a false breakout reversal trade, verify at least two of the following institutional confirmation filters:
📊 Institutional Trap Confirmation Suite:
- Option Chain Open Interest (OI) Divergence: If Nifty breaks 25,000 resistance, genuine short-covering requires the 25,000 Call OI to drop dramatically (negative change in OI). If Call writers are instead adding fresh contracts during the breakout, smart money is aggressively capping the upside. The breakout will fail within minutes.
- Cumulative Volume Delta (CVD) Divergence: On advanced order-flow charts, price creates a higher high, but the CVD delta makes a lower high or remains deeply negative. This indicates that the new high was driven by passive limit absorption rather than aggressive institutional buying.
- VWAP (Volume Weighted Average Price) Reclaim: A genuine breakout pulls away from VWAP and holds. A false breakout spikes above resistance, rolls over, and slices back below VWAP with expanding volume.
- Heavyweight Stock Alignment: Nifty cannot sustain a breakout if its primary engine, Reliance Industries and HDFC Bank, are trading negative on the day. If Bank Nifty breaks out while HDFC Bank and ICICI Bank are lagging, it is an 80% probability trap.
5. Precise Execution Blueprint: Entry, Stop-Loss & Risk Architecture
The greatest strategic advantage of trading false breakouts is asymmetry. Because your entry occurs right at the point of market exhaustion, your stop-loss is mathematically tiny, while your potential target covers the entire day's trading range.
🎯 The Trap Trade Execution Rulebook:
- Trigger Candle: Identify the 5-minute candle that swept the high and closed with an upper shadow (wick >= 40% of total candle height).
- Entry Point: Place a Sell Stop-Market order 1 point below the low of the sweep candle.
- Stop Loss: 2 points above the extreme wick high. If Nifty was sweeping 25,080, and the sweep wick hit 25,088, your stop loss is strictly 25,090 (risk: 18-22 index points).
- Target 1 (50% Quantity): Session VWAP (book 1:2 risk-to-reward and trail stop loss to cost).
- Target 2 (Remaining 50%): Day's Low or opposite range boundary (often yielding 1:3.5 to 1:5 risk-to-reward).
6. True Breakout vs. False Breakout Trap: Indicator Matrix
Keep this comparative matrix on your trading desk to filter trades during market hours:
| Technical Factor | Genuine High-Probability Breakout | Engineered False Breakout (Trap) |
|---|---|---|
| Candle Close (5-Min) | Full-bodied bullish candle closes decisively above resistance | Candle pokes above and closes back inside with long upper wick |
| Volume Expansion | Volume spikes 2-3x above 20-period moving average on the close | Volume spikes on the wick, then completely dries up on follow-through |
| Option Chain (OI) | Aggressive Call unwinding (negative change in Call OI at resistance strike) | Call Open Interest increases or remains sticky as smart money writes calls |
| Session VWAP | Price holds comfortably above VWAP and uses it as dynamic support | Price rejects resistance and rapidly collapses back below VWAP |
| Retail Sentiment | Driven by FOMO (Fear of Missing Out) and chasing green candles | Driven by patience, order flow mechanics, and institutional liquidity |
| Slippage & Fills | Suffers extreme slippage buying at peak expansion | Fills cleanly as trapped traders are forced to liquidate |
Prasad Sogi Market Masterclass: Price Action, Option Traps & Systematic Wealth Strategies
Comprehensive breakdown of index price action, risk management principles, and mathematical frameworks to build sustainable long-term market wealth.
🎯 Master Institutional Order Flow: Advanced Price Action & Portfolio Execution
Are you tired of buying breakouts that immediately collapse? Are you struggling to separate noise from high-probability institutional liquidity sweeps in Nifty and Bank Nifty?
Join our comprehensive Advanced Price Action & Systematic Risk Architecture Mentorship curated by Prasad Sogi. Learn how to read live option chain order flow, execute asymmetric 1:3+ trap trades, and construct robust wealth management portfolios.
💬 Connect on WhatsApp for Workshop & Portfolio Review (+91 72596 58038)Frequently Asked Questions (FAQ)

About the Author: Prasad Sogi
Prasad Sogi brings over 13+ years of elite engineering and technical leadership experience from tech giants IBM and Hewlett-Packard (HP). Combining mathematical precision, algorithmic order-flow architecture, and risk engineering, he provides data-driven financial advisory, portfolio structuring, and price action analytics to investors across India.